Analysis of Low-cost PM2.5 Trends Over Southern California Due to Summertime Wildfires
As the expansion of the logistic industry continues in the Inland Empire, it has potentially made tremendous adverse impacts on the local community's air quality. Furthermore, for the affected communities that are already struggling with the worst air quality in the nation, the expansion of the transportation industry made certain communities even more vulnerable to exposure to polluted air. In recent years, low-cost air monitoring networks have expanded throughout southern California and all across the U.S. The low-cost sensor data can provide meaningful air quality information for researchers to study and understand air pollution trends. Last year Yi participated in multiple research projects related to low-cost sensor studies.
Yi has worked with Dr. Ivey in the AQMEL group for the past 2 years. Her research project for 2020 has been focused on the analysis of low-cost PM2.5 trends over Southern California due to summertime wildfires. The objective of this research is first to compare summertime PM2.5 concentrations between coastal and inland regions, and second, study the PM2.5 impact due to wildfires using the data collected from lowcost sensors.
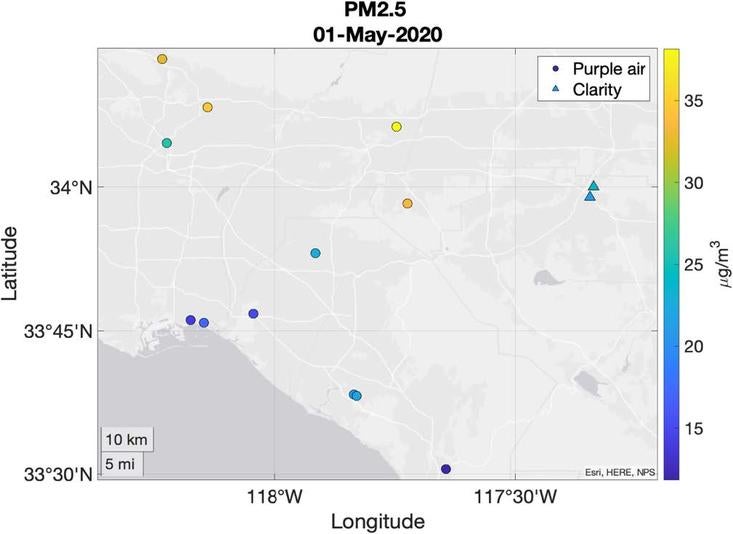
To begin the project, she selected six SCAQMD PurpleAir sensors and two Clarity sensors within the SCAQMD inland region. Additionally, six SCAQMD PurpleAir sensors within the SCAQMD coastal region were also selected. Both PurpleAir and Clarity are low-cost air quality sensors that monitor the presence of air pollution in the surrounding area. After selecting sensors in desired locations, PM2.5 data was collected hourly from May 2020 through August 2020 for each sensor and updated the data to reflect the desired time zone. To better understand the summertime PM2.5 behavior, PM2.5 data was analyzed and compared from three different time periods. The data was then separated by time series into daytime (6am-4pm), nighttime (5pm-9pm) and midnight to dawn (10pm-5am). Boxplots and times series were used in this study to better observe the trends of summertime PM2.5 levels in various locations. An overview of the map with the location of each sensor is indicated in Figure 1. The circle legend represents PurpleAir sensors, and the triangle legend represents Clarity sensors. According to Yi’s results, PM2.5 concentrations were highest during daytime and lowest during midnight. This result is expected because human activity is busiest during the day; thus, PM2.5 rises with the increase in human activity. However, other atmospheric processes are known to increase nighttime PM2.5. The second observation that she found from her results is that the coastal region has a lower PM2.5 concentration than the inland region. This outcome can be associated with the geological structure, wind direction, and industrial activity.

Due to California’s unique landscape and climate, multiple wildfire events inevitably occur every year during the fire season. Additionally, air pollution due to wildfires can significantly impact the health risk for vulnerable communities. The Apple Fire is one of the biggest fires that burned last year in the Inland Empire region. It ignited on July 30, 2020, and was 90% contained on August 18, 2020. The wildfire was located in the San Bernardino National Forest and charred 33,424 acres of land.
In this study, Yi selected eight PurpleAir sensors located in cities next to the Apple Fire to monitor the air quality impact due to the wildfire smoke. I downloaded the hourly PM2.5 readings from July 28, 2020, to August 19, 2020, to track the entire duration of the wildfire event. The sensors' locations are plotted into a U.S. map with color bars to indicate the hourly averaged PM2.5 concentration for each day. NASA worldview images were used to determine the direction of the wildfire smoke. Finally, a boxplot was created to analyze the hourly averaged PM2.5 concentration for all eight locations. From the boxplot analysis, downwind areas from the fire were observed to have the highest PM2.5 concentrations. This work contributed to preliminary data for Dr. Ivey.
